
Bloggar
On attending GIS day in Aarhus
My name is Aurélie, I am a geographer specialised in geo-informatics. I am a new team leader for the expertise of spatial planning at the faculty of bioeconomy and a new project leader at Novia UAS. The objective I need to reach is to develop awareness and competence about geographic information. Geographic information can tell you anything you want to know about any location you like; and that information is crucial to act efficiently every day.
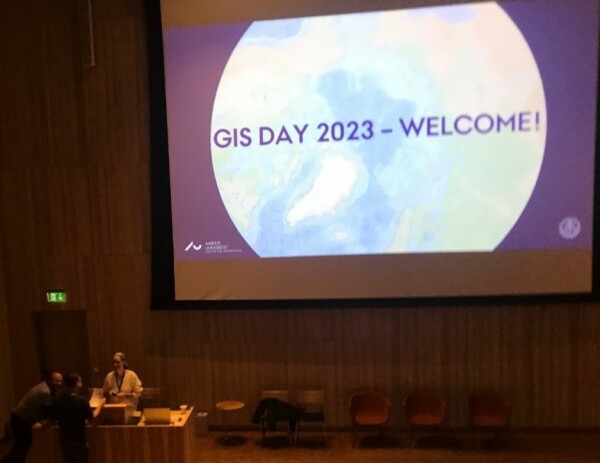 GIS day getting ready to be launched. Credit: Aurelie Noel.
Every year since 1999, the third Tuesday of November is a dedicated GIS day. GIS is the acronym for Geographic Information Systems. GIS tell you what’s where, why is it there and why we should care (my thoughts but not my words: check out this short video (3 min) and how Joseph Kerski from ESRI explains it). GIS build the narrative frame of an event, and we need this kind of storytelling to understand the world around us (quoting one of the presenters, Geoff Groom). Some institutions use that day to present GIS-linked research and projects such as Aarhus University (AU), in Aarhus, Denmark. For the first time in more than 10 years of running, the AU GIS committee opened their GIS day to outsiders. And what I liked about this event is the showcasing of interdisciplinary GIS applications such as archeology, health, real estate, or history, and I needed to check it out (and it was in English).
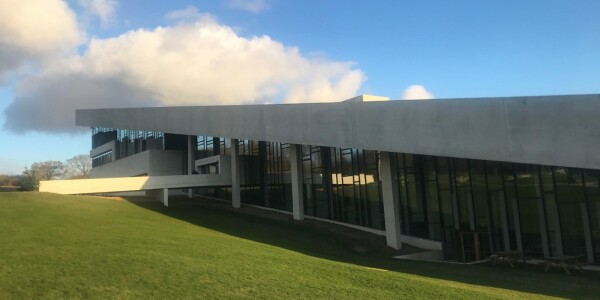 Beautiful day and setting to talk about GIS – Moesgaard museum. Credit: Aurelie Noel.
First, we got to dive into the past with projects using diachronic analysis. This kind of analysis allows us to see changes through time by comparing the same space at different periods. Whether it was digitizing (1) 150 years old contour lines to estimate rainfall runoff change with today’s digital elevation model (2); or geotagging (3) old landscape pictures to compare with current ones and see the change with your own eyes, and not through a computed analysis. Then, the presentation about Pompeii held my breath. The presenter Laura Helena Nissin showed how spatial analysis highlighted potential roles of fountains and street altars. More specifically, how the movement analysis to those places might explain the city neighborhoods settings.
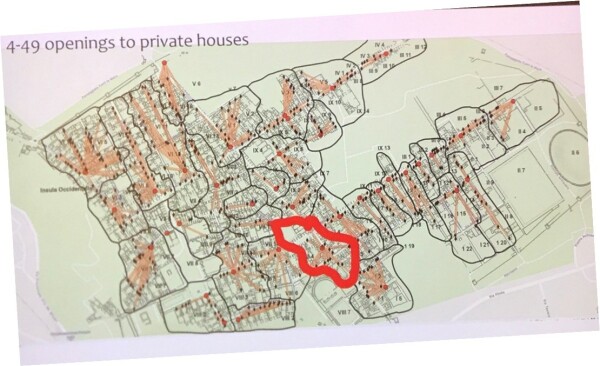 Laura got some laughs as she mentioned that, although she ran the analysis, she still used good ol’ PowerPoint pen to draw neighborhood limits, emphasizing how long (and frustrating) is the learning curve but how rewarding it is when it works (the GIS community understands you so well)! Credit: Aurelie Noel.
As far as sparkling ideas goes, I also appreciated the presentation about Cold-War civil defense bunker mapping in Aarhus. It reminded me about a conversation I had when I moved in Finland last year. A colleague told me repeatedly that I needed to know where the closest bunker from my house was, following Finland’s membership in NATO. Surprisingly, it seems that that information is not so easily available in our area (or at least not as easy as in Helsinki for example). At this point, I want to investigate this further with our surrounding municipalities and maybe use citizen science. The use of GIS in the AU building management and parks also inspired me. I need to find out if we have such a map for the campuses (where to find that room, that library, that person, the printer, the canteen – and how to get there from where I am). Finally, I also saw a fantastic opportunity for education and collaboration between AU and Novia developing CubeSat (4) for on-demand and easy access of satellite images. I decided to get actors from both sides in connection. Who knows!
Those are only some of the presentations of that day, but they displayed different ways of using GIS and, even more interesting, different ways of incorporating GIS in research when it is not embedded in your background. One presenter used a lot of trials and errors, and online tutorials, another called the AU GIS team to the rescue, and another had GIS rooted in theory but not so much practically. It shows that GIS is for everybody, for every kind of project in every kind of field of expertise.
Finally, I met with Mette Balslev Greve, who is the AU GIS coordinator and chairperson of the GIS committee. She confessed that although her team has a long history with AU, all it really needs is to engage and get people interested in GIS. As there is no geographic department per se at AU, she noticed that GIS needs emerged on its own everywhere; and setting up a centralized team of experts greatly simplified collaboration to fulfill those needs. The team also uses “hangouts”, a way to have information/training/consulting/mentoring thematic sessions with some freedom. Now, I know additional ways of getting Novia excited about GIS as much as I am.
And if you too are getting excited about GIS and want to know more about what Novia is already doing, and what Novia wants and needs in terms of geographic information, go read this blog, fill in the survey (3-4 minutes max) and check this coming elective course.
Some definitions so you start also to be versed in GIS-slang:
- Digitizing: Digitizing in GIS is the process of converting geographic data either from a hardcopy or a scanned image into vector data by tracing the features.
- Digital elevation model: it is a 3D computer graphics representation of elevation data to represent terrain relief.
- Geotagging: action of localizing an image in space, for example, by attributing coordinates to a picture based on the location of the media device.
- CubeSat: is a class of miniaturized satellite with a form factor of 10 cm cubes (NASA).
Texten har granskats av Novias campusredaktion och publicerats 14.12.2023
Bioekonomi
Blogginlägg som är granskat av Novias redaktionsråd är utmärkta med nyckelordet "Granskat inlägg".
Vi följer CC-BY 4.0 om inget annat nämns.
Ansvarsfriskrivning: Författaren/författarna ansvarar för för fakta, möjlig utebliven information och innehållets korrekthet i bloggen. Texterna har genomgått en granskning, men de åsikter som uttrycks är författarens egna och återspeglar inte nödvändigtvis Yrkeshögskolan Novias ståndpunkter.
Disclaimer: The author(s) are responsible for the facts, any possible omissions, and the accuracy of the content in the blog.The texts have undergone a review, however, the opinions expressed are those of the author and do not necessarily reflect the views of Novia University of Applied Sciences.